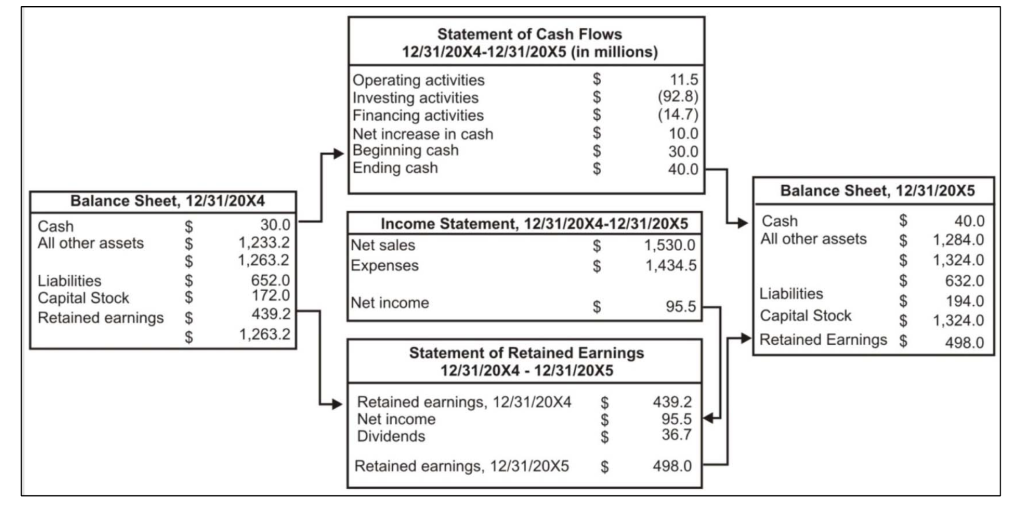
The flow of the financial statements..
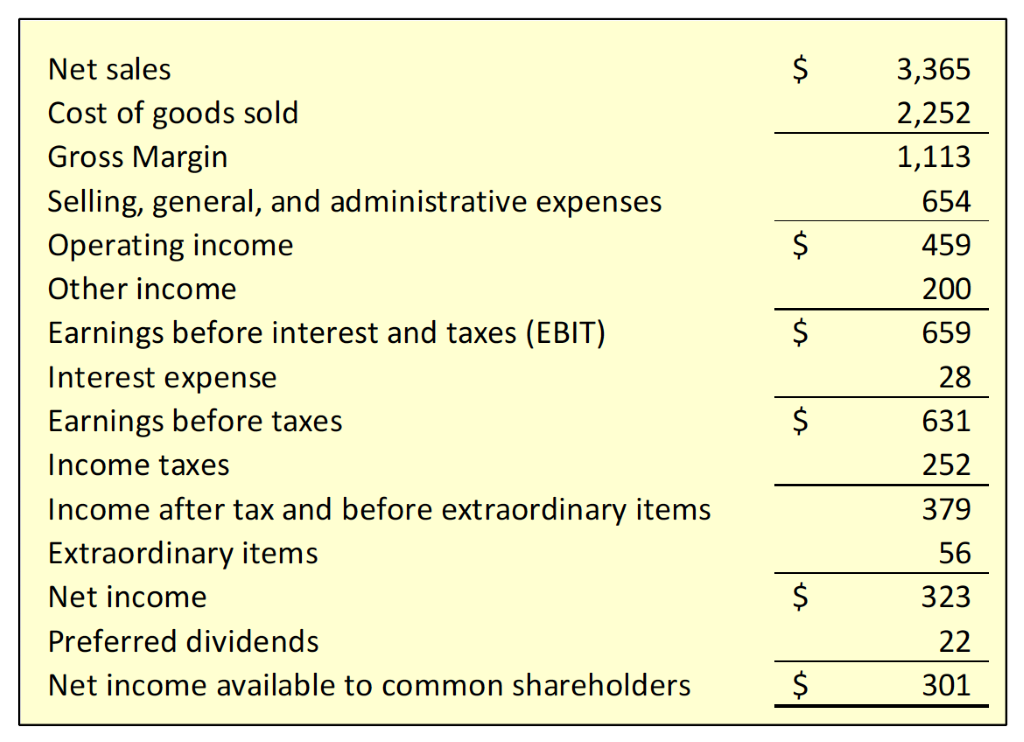
Income Statement: Operating income vs non-operating income – If we’re looking to value OPERATIONS ONLY, we’re stopping at the EBIT! After the EBIT come the financial performance.
Operating Income: the income generated by the firm’s core business operations.
Non-operating Income: income generated by investments the firm has made in assets that are unrelated to the firm’s primary business. For example:
- Gains from the sale of investments
- The sale of a subsidiary or division
- Costs incurred from restructuring
- Currency exchange
- The write-off of obsolescent inventory
The Balance Sheet: provides a snapshot of the firm’s financial position at a moment in time and a detailed account of the company’s assets’ liabilities (debts), and shareholders’ equity. The balance sheet equation requires that the sum of the book values of the firm’s assets equal the sum of the debts the firm owes to its creditors plus the investment of the stockholders’ equity.
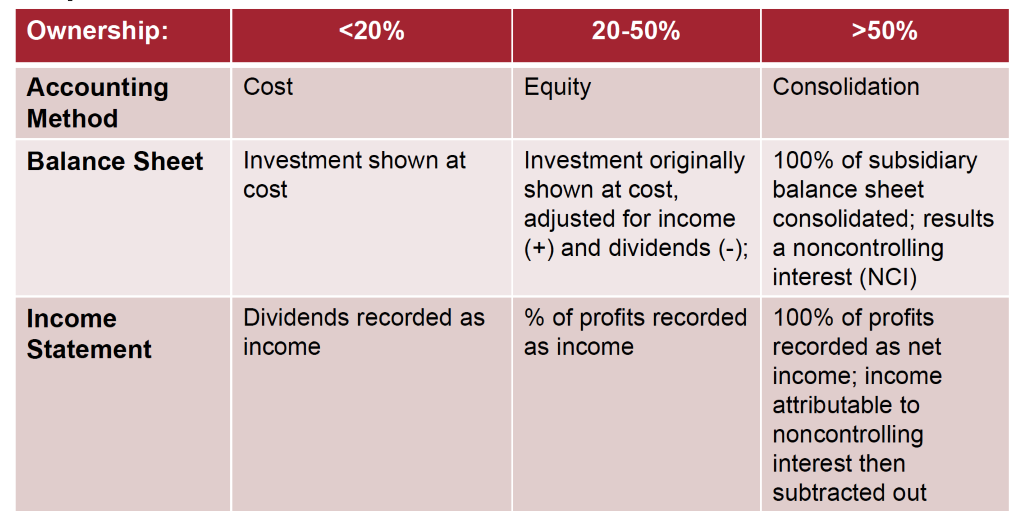
Consolidation Rules:
- An equity investment involving more than 20% but less than 50% of the equity of another firm is recorded as an investment. This will typically show up on the balance sheet as ‘investments in unconsolidated subsidiaries’.
- If the firm owns more than 50% of a subsidiary, then the rules of accounting call for consolidation of the subsidiary into the firm’s balance sheet and income statement. A minority interest account appears between liabilities and shareholders’ equity, representing the value of the minority-owned shares, because 100% of the value of the subsidiary’s assets were incorporated into the consolidated balance sheet.
- The presence of a long-term investment category on a firm’s balance sheet signifies the presence of a potentially significant non-operating asset that will need to be valued. This means that the analyst will need to dig deeper into the footnotes of the financial statement to determine the exact nature of the investments in order to determine an appropriate approach to valuing them. This line item (sometime referred to as long-term investments because they are assets the company intends to hold for longer than one year) can consist of stocks and bonds of other companies, real estate, as well as cash set aside for a specific purpose.
Ratio Analysis
Categories of ratios:
- Profitability Ratios
- Profit margin (net income/sales)
- Return on assets (ROA) = net income/total assets
- Return on equity (ROE) = net income/total equity
- Short-term solvency (liquidity ratios)
- Current ratio (CA/CL)
- Quick ratio (CA-inventory)/CL
- Long-term solvency
- Leverage ratios
- Total liabilities to total assets (TL/TA)
- Total liabilities to total equity (TL/TE)
- Total assets to Owners’ equity (equity multiplier): TA/TE
- Total debt to equity (TD/TE)
- Coverage ratios
- Times interest earned/EBIT interest coverage (EBIT/interest)
- Cash coverage/EBITDA Interest coverage (EBIT + Depreciation)/Interest
- Leverage ratios
- Asset utilization ratios (AKA Activity)
- Total assets turnover (sales/total assets)
- Inventory turnover (COGS/inventory)
- The longer inventory sits on a company’s shelves, the lower the rate of return on those assets, and the greater their vulnerability to falling prices and obsolescence. You want to keep your inventory turning, however not at the expense of your overall profit margins or business strategy
- Days in inventory (365/inventory turnover)
- Receivables turnover (sales/avg. Accounts receivable)
- Avg. Collection period (365/receivables turnover)
- Valuation multiples
Benchmarking using ratios: so, what is a good benchmark?
It is often not clear what is a ‘good’ or ‘bad’ level for a financial ratio and no one benchmark exists for all companies in all valuation contexts. We know ratios vary over time and we know they vary by industry – we also know that companies tend to regress towards the mean – so a common benchmark is the company’s industry or comparable group. That said – deviations from the ‘norm’ might be good and indicate an industry leader and a potential competitive advantage.
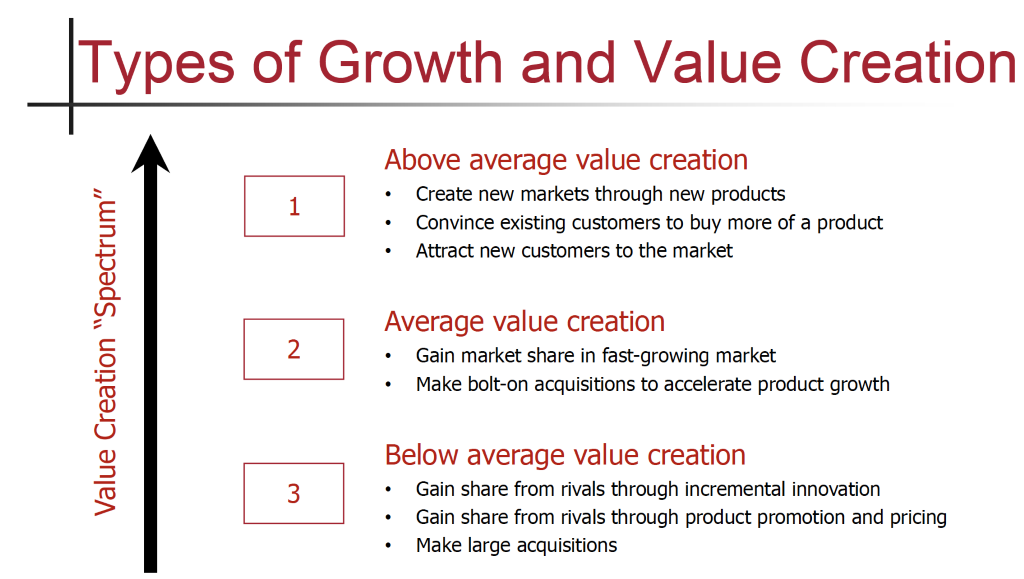
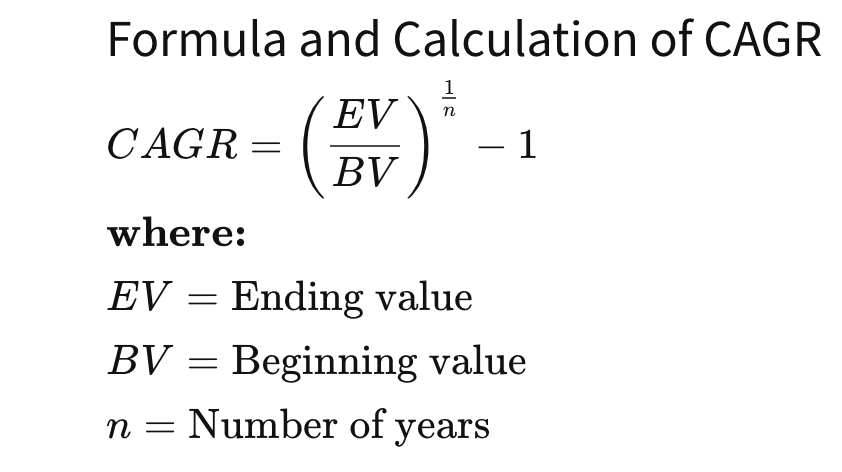
Sales Growth Rate (CAGR = Compounded Annual Growth Rate)
ales growth is an important driver of the need to invest in various types of assets and of the company’s value. It also provides some indication of the effectiveness of firm’s strategy and product development activities.
Analyzing Growth:
Growth can be disaggregated into three main components:
- Portfolio Momentum: organic revenue growth a company enjoys because of overall expansion in the market segements of its portfolio
- Market share performance: organice revenue growth from a company gaining or losing share in a particular market
- Mergers and acquisitions: inorganic growth a company achieves when it buys or sells revenues through acquisitions or divestments
Growth and Value: growth translates to value when return on invested capital (ROIC) exceeds the cost of capital(!!!). Sustaining high growth is much more difficult than sustaining ROIC. Despite some variation on the patterns of growth, high growth is not sustainable, due to the natural cycles of products.